> For the complete documentation index, see [llms.txt](https://docs.colt.net/llms.txt). Markdown versions of documentation pages are available by appending `.md` to page URLs; this page is available as [Markdown](https://docs.colt.net/portals/sd-wan-versa/sd-wan-analytics.md).
# SD WAN ANALYTICS
SD WAN with Versa Networks: Analytics
SD WAN branches, hubs, and controllers generate various logs and events for providing topology view, availability reports, traffic visibility reports, and SLA metrics.
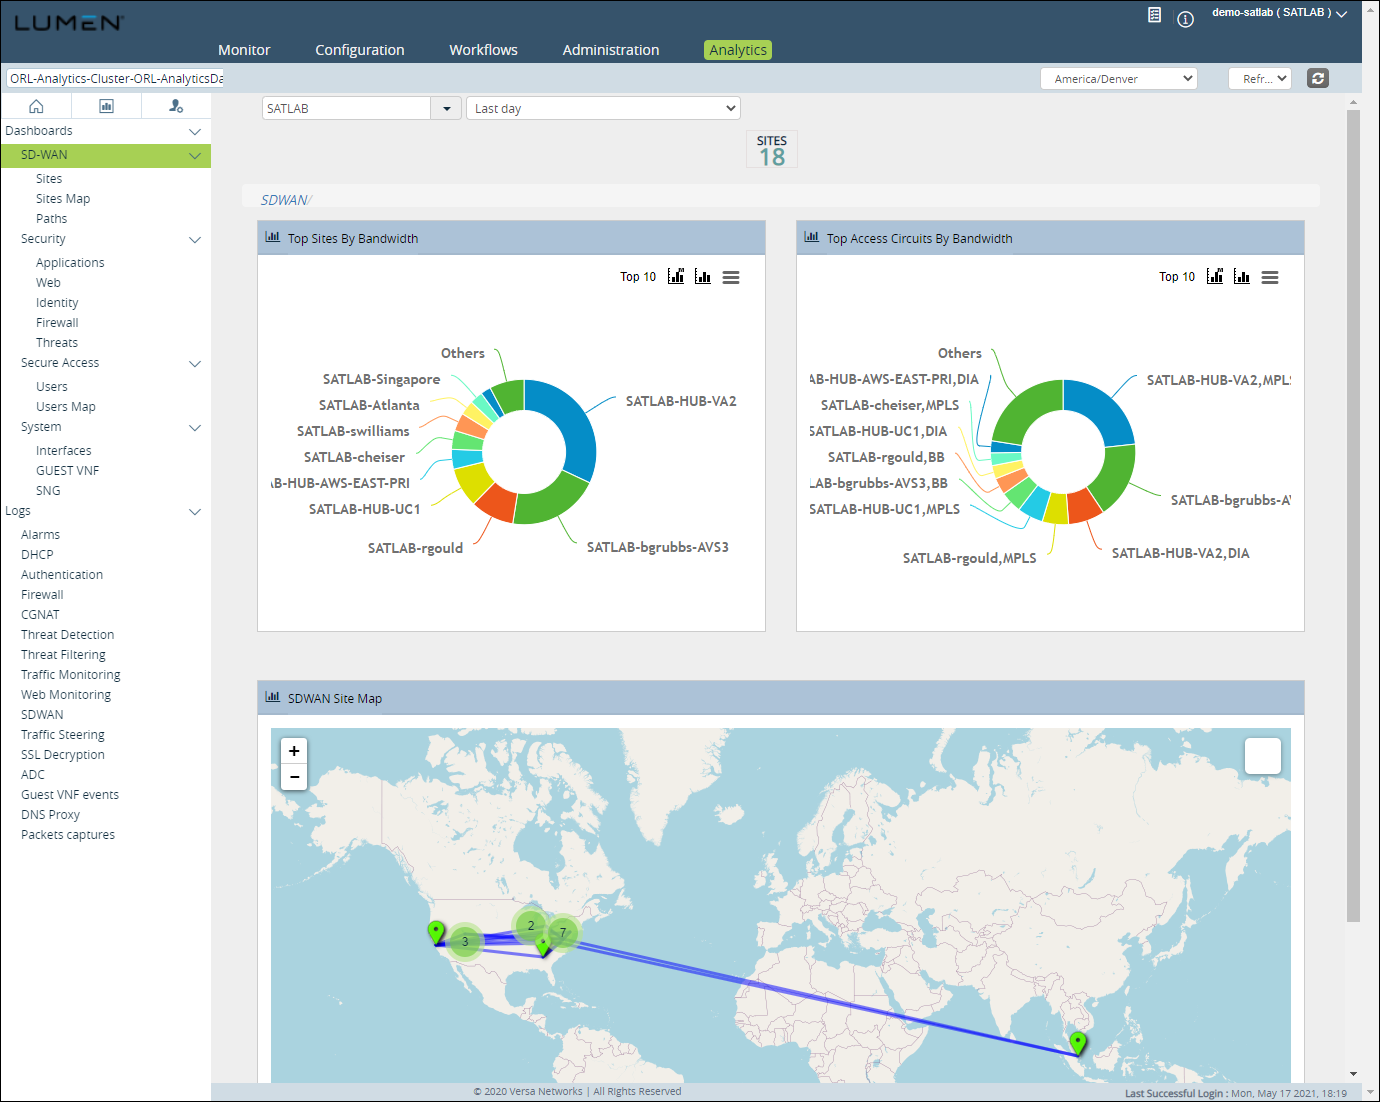
Select the Director context in Versa Director and then select the Analytics tab > Home > SD-WAN to view the SD WAN analytics dashboard. The dashboard provides you with a tenant-level view across all the sites:\
* top sites by bandwidth
* top access circuits by bandwidth
* SD WAN site map\
The screenshot to the right shows the SD WAN dashboard displaying top sites by bandwidth, top access circuits, and the SD WAN site map.
### DASHBOARDS
#### VIEWING A MAP OF YOUR SD WAN SITES
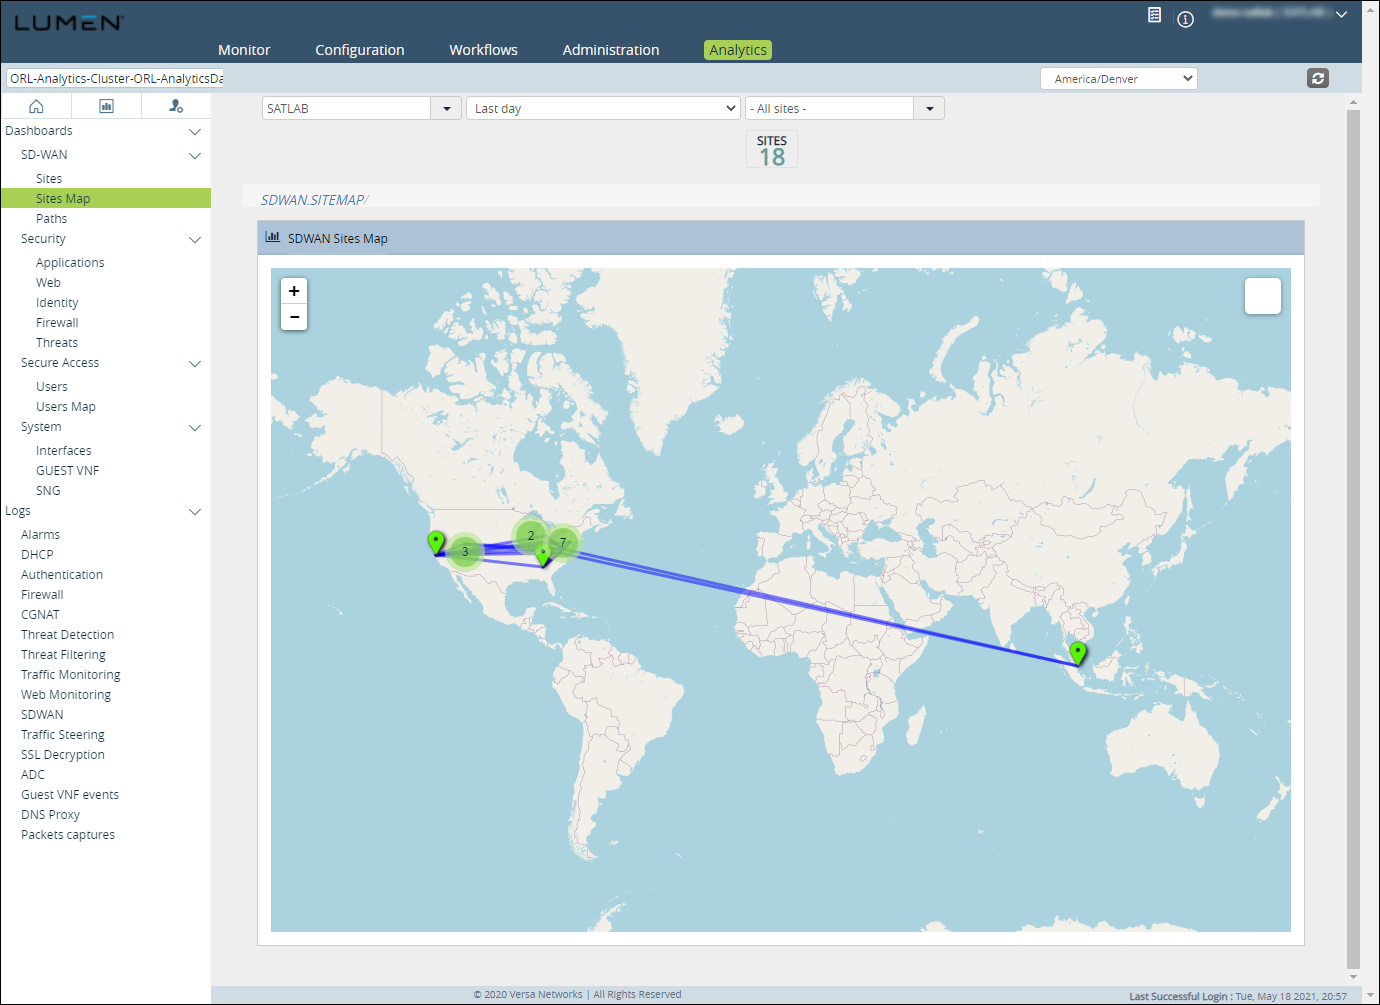
In Versa Director, you can view a map of your SD WAN sites. From the map, you can click on a location to view details for the site, such as bandwidth, connections, and volume.
To view a map of your SD WAN sites:
1. Sign in to Versa Director.
2. Click the Analytics tab, click the Dashboard tab.
3. From the left menu on the left, select Dashboards > SD-WAN > Sites Map. Versa Director shows a map of your SD WAN sites.
### REPORTING
#### SAVING AND SCHEDULING A REPORT
You can save a report in Versa Director and schedule that report to be delivered by email to people in your organization on a regular basis.
To save and schedule a report:
1. Sign in to Versa Director.
2. Click the Analytics tab, click the Reporting tab, then click Build.
3. Select the service, report type, appliance(s), chart type metrics, then click Add. Versa Director adds the information to the report.
4. Click the save icon.
5. In the Name field, type a name for the report.
6. From the PDF Template list, select the template you want to use for the report. (If you don't have a template, select default.)
7. If you want to schedule the report to run regularly, click the Schedule checkbox, then do the following:
1. Click the radio button to select how frequently you want to receive the report.
2. If you only want to receive the report until a specific day/time, click the Expiration checkbox, then set the date/time for the report to stop running.
3. In the Email notification recipients field, type the email address(es) you want the report delivered to. (If you're sending the report to multiple addresses, use a comma to separate the addresses.)
4. Select the checkbox to have the report delivered as a PDF, CSV, or both.
5. Click Ok. Versa Director then schedules the report.
#### VIEWING A LIST OF SCHEDULED REPORTS
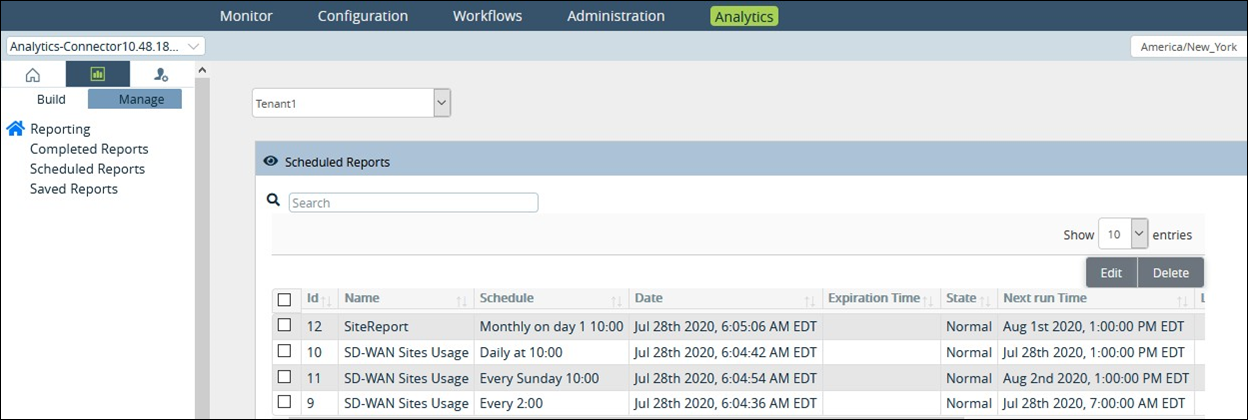
You can view a list of reports you currently have scheduled to run in Versa Director. From the list, you can delete or edit the scheduled reports as your analytics needs change.
To view a list of scheduled reports:
1. Sign in to Versa Director.
2. Click the Analytics tab, click the Reporting tab, then click Manage.
3. From the Reporting menu on the left, select Scheduled Reports. Versa Director lists the reports you currently have scheduled.
---
# Agent Instructions
This documentation is published with GitBook. GitBook is the documentation platform designed so that both humans and AI agents can read, navigate, and reason over technical content effectively. Learn more at gitbook.com.
## Querying This Documentation
If you need additional information that is not directly available in this page, you can query the documentation by asking a question.
Perform an HTTP GET request on the following URL with the `ask` and `goal` query parameters:
```
GET https://docs.colt.net/portals/sd-wan-versa/sd-wan-analytics.md?ask=&goal=
```
`ask` is the immediate question: it should be specific, self-contained, and written in natural language.
`goal` is what the user is ultimately trying to achieve, the reason they need the answer. Sharing it helps GitBook give you a better, more relevant answer. A goal is most helpful when it describes the outcome the user wants rather than restating the question. For example, with `ask=how do I create an API token`, a goal like `automate deployments from our CI pipeline` lets GitBook tailor the answer to that use case.
The response will contain a direct answer to the question and relevant excerpts and sources from the documentation.
Use this mechanism when the answer is not explicitly present in the current page, you need clarification or additional context, or you want to retrieve related documentation sections.