> For the complete documentation index, see [llms.txt](https://docs.colt.net/llms.txt). Markdown versions of documentation pages are available by appending `.md` to page URLs; this page is available as [Markdown](https://docs.colt.net/portals/sd-wan-versa/getting-started/analytics-dashboards.md).
# EXPLORING SD WAN ANALYTICS DASHBOARDS
Exploring the SD WAN Analytics dashboards
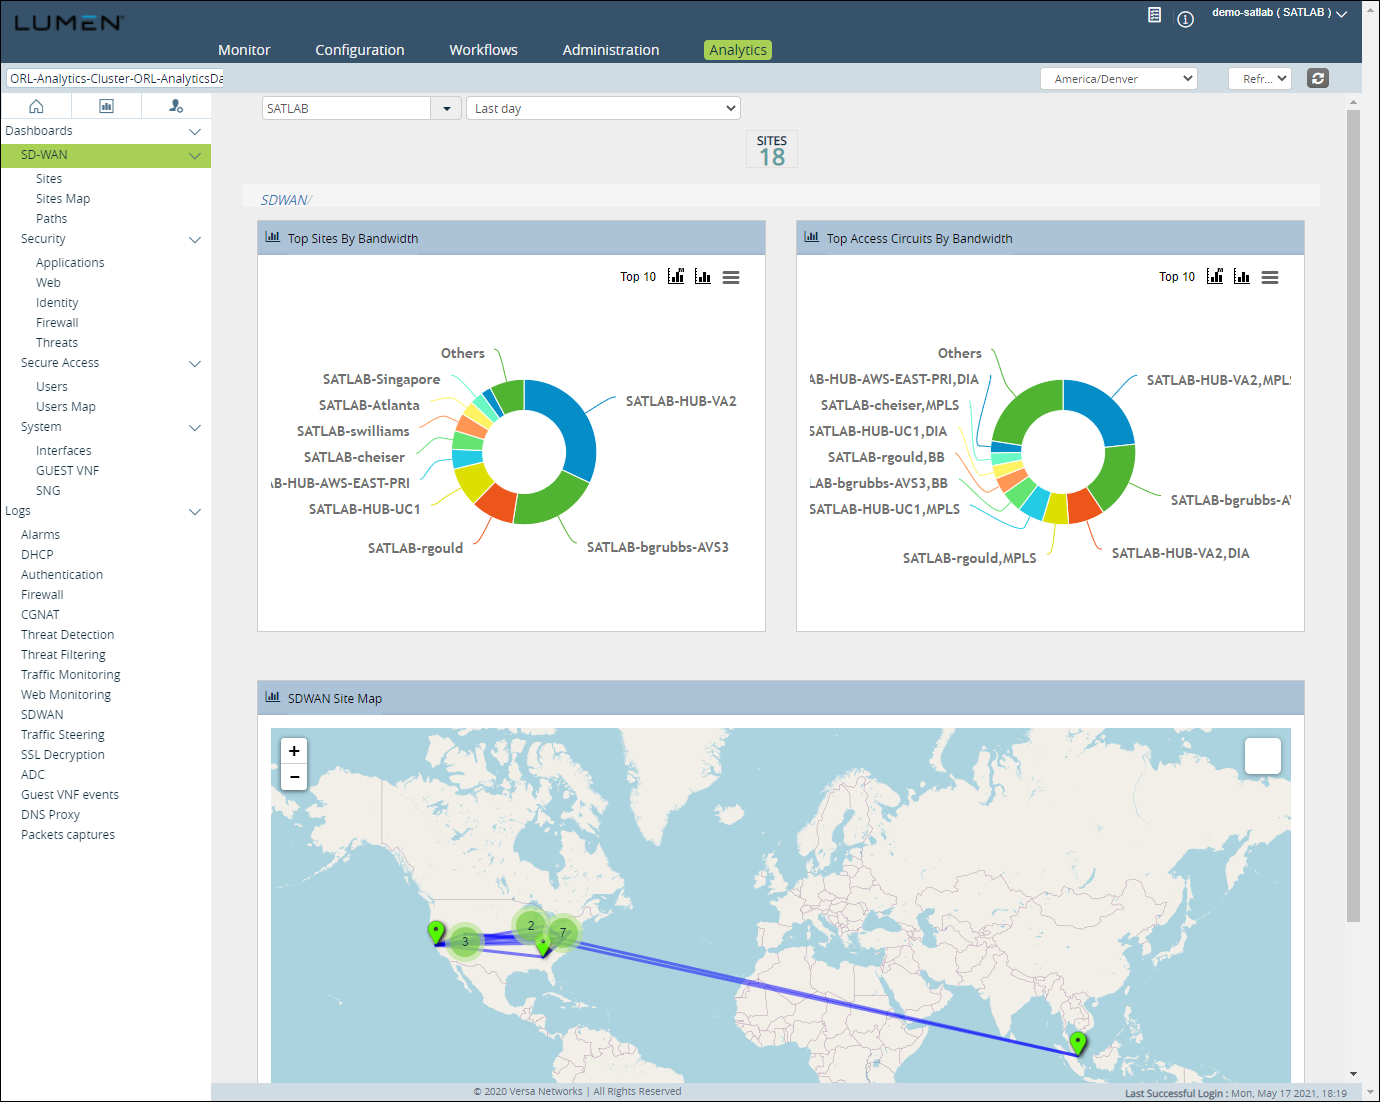
The SD WAN analytics dashboards shows your traffic detail on the SD WAN appliance and the performance of its paths to other appliances.
Information you can get from the dashboards includes:\
* Availability—shows appliance availability
* Access circuits—shows traffic by circuit
* Users—shows traffic by IP/user
* Applications—shows traffic by application
* Rules—shows performance metrics and traffic by forwarding profile
* SLA metrics—shows use of your total WAN traffic
* SLA violations—shows violations
* VRF—shows latency to monitored applications
* QoS—traffic by QoS tier
* APM—VRF traffic by routing instance
* MOS—scores for real-time traffic
There are three views under the **Analytics** tab:
* [Dashboard view](https://docs.colt.net/portals/sd-wan-versa/getting-started/analytics-dashboards.md)
* Reporting view
* Administrator view
### DASHBOARD VIEW
The Dashboard view also provides log information for:
{% columns %}
{% column %}
* Alarms
* DHCP
* Firewall
* CGNAT
* DOS
* IDP
* Antivirus
* URL filtering
* IP filtering
{% endcolumn %}
{% column %}
* Traffic monitoring
* Web monitoring
* SD WAN
* SD WAN SLA violation
* SSL decryption
* ADC
* Guest VNF events
* Packet captures
{% endcolumn %}
{% endcolumns %}
You can also filter at various levels:
1. For a tenant
2. All the appliances or for an individual appliance
3. Time selector (Last 5 mins, last 15 mins, last 30 mins, last hour, last 12 hours, last day, last 7 days, last months or custom range)
The dashboard also provides you with a facility to see the latest data.
* Click Refresh to fetch the latest data based on every 1, 10 or 15 minutes.
* Click the Manual Refresh icon for a manual refresh. Each tile in the dashboard allows you to change the graphical representation of the data.
* Click the Chart icon in each tile to change the current graphical data representation to a column, bar, pie, or line chart.
* Click the Print/Download icon in the tile to download the chart as an image for further analysis. You can save the data as a PNG, JPEG, PDF, or SVG vector.
* Click the Chart with Metrics icon in the tile to view the same graph with various metrics view. You can view metrics based on these typical usage reports:
* bandwidth
* volume Tx
* volume Rx
* volume Tx, Rx
* uplink/downlink bandwidth\
The dashboard allows you to either minimize or maximize each tile to suit your viewing requirement.
* [Viewing a map of your SD WAN sites](https://docs.colt.net/portals/sd-wan-versa/sd-wan-analytics/maps.md)
### REPORTING VIEW
Use the Reporting view to build custom reports in PDF, XLS, and JSON format. You can schedule and generate the reports periodically and send it as an email.
* [Saving and scheduling a report](https://docs.colt.net/portals/sd-wan-versa/sd-wan-analytics.md#saving-and-scheduling-a-report)
* [Viewing a list of scheduled reports](https://docs.colt.net/portals/sd-wan-versa/sd-wan-analytics.md#viewing-a-list-of-scheduled-reports)
---
# Agent Instructions
This documentation is published with GitBook. GitBook is the documentation platform designed so that both humans and AI agents can read, navigate, and reason over technical content effectively. Learn more at gitbook.com.
## Querying This Documentation
If you need additional information that is not directly available in this page, you can query the documentation by asking a question.
Perform an HTTP GET request on the following URL with the `ask` and `goal` query parameters:
```
GET https://docs.colt.net/portals/sd-wan-versa/getting-started/analytics-dashboards.md?ask=&goal=
```
`ask` is the immediate question: it should be specific, self-contained, and written in natural language.
`goal` is what the user is ultimately trying to achieve, the reason they need the answer. Sharing it helps GitBook give you a better, more relevant answer. A goal is most helpful when it describes the outcome the user wants rather than restating the question. For example, with `ask=how do I create an API token`, a goal like `automate deployments from our CI pipeline` lets GitBook tailor the answer to that use case.
The response will contain a direct answer to the question and relevant excerpts and sources from the documentation.
Use this mechanism when the answer is not explicitly present in the current page, you need clarification or additional context, or you want to retrieve related documentation sections.